Configure Envoy for Dynatrace
Dynatrace version 1.290+
An important part in tracing is to have a stable, single point in your architecture where trace initialization, such as starting new or continuing existing traces using context propagation, is guaranteed. With network requests first arriving at the network edge, that is the ideal place to ensure this and it can be achieved with a centrally deployed reverse proxy which receives the requests, starts the trace, and routes the request to the desired backend, along with context propagation.
One of the options to configure such a setup is the Envoy platform in its version 1.29 or higher.
To instrument Envoy 1.28 and earlier, use OneAgent with the applicable Envoy code module and activate Envoy monitoring by enabling Monitor Envoy under Settings > Monitoring > Monitored technologies.
With Envoy 1.27, you can export traces using OpenTelemetry as well, but need to use an additional Collector instance to convert gRPC to HTTP. See Transform OTLP gRPC for an sample configuration.
Configuration prerequisites
The following prerequisites are necessary to configure your Envoy instance to export traces to Dynatrace:
Envoy 1.29 (or higher)
- The OTLP traces URL for the export
- An access token with the relevant scopes
openTelemetryTrace.ingest, when you export to ActiveGateadaptiveTrafficManagement.read, when you use sampling with Envoy 1.30 or higher
When using the OpenTelemetry exporter in Envoy, the OneAgent Envoy monitoring needs to be turned off, to avoid interferences in the configuration. Follow the steps below to disable it according to your needs.
- Go to the applicable configuration page
- For the entire environment, Settings > Monitoring > Monitored technologies.
- For a particular host, Your host > Host settings > General.
- Find Envoy in the list of monitored technologies, and select Edit (pencil icon).
- Click on the toggle Monitor Envoy to disable Envoy monitoring.
 Find the Envoy configuration file
The Envoy configuration is stored in a YAML file whose path is passed with the Envoy command line argument --config-path. If you are not sure where the file is located, check the Envoy launch command for that value.
 Get configuration entries
- In Dynatrace Hub, search for
Envoy. Select the Hub entry for Envoy.
- Select Set up.
Follow steps 3 and 4 here and use (and adjust) the two provided configuration snippets where applicable.
 Add Dynatrace cluster entry for OpenTelemetry export
For Envoy to send traces to Dynatrace, you first need to configure a cluster entry for Dynatrace in the Envoy configuration file. For that, add the cluster configuration entry as obtained in step 2 under the top-level clusters key.
 Configure the OpenTelemetry tracer
Next, you need to add the tracing provider to the HTTP connection manager filter in the Envoy configuration file under static_resources - listeners - filter_chains - filters.
As Envoy 1.29 and its successor versions support slightly different feature-sets, there are two different ways to configure this.
 Verify the setup
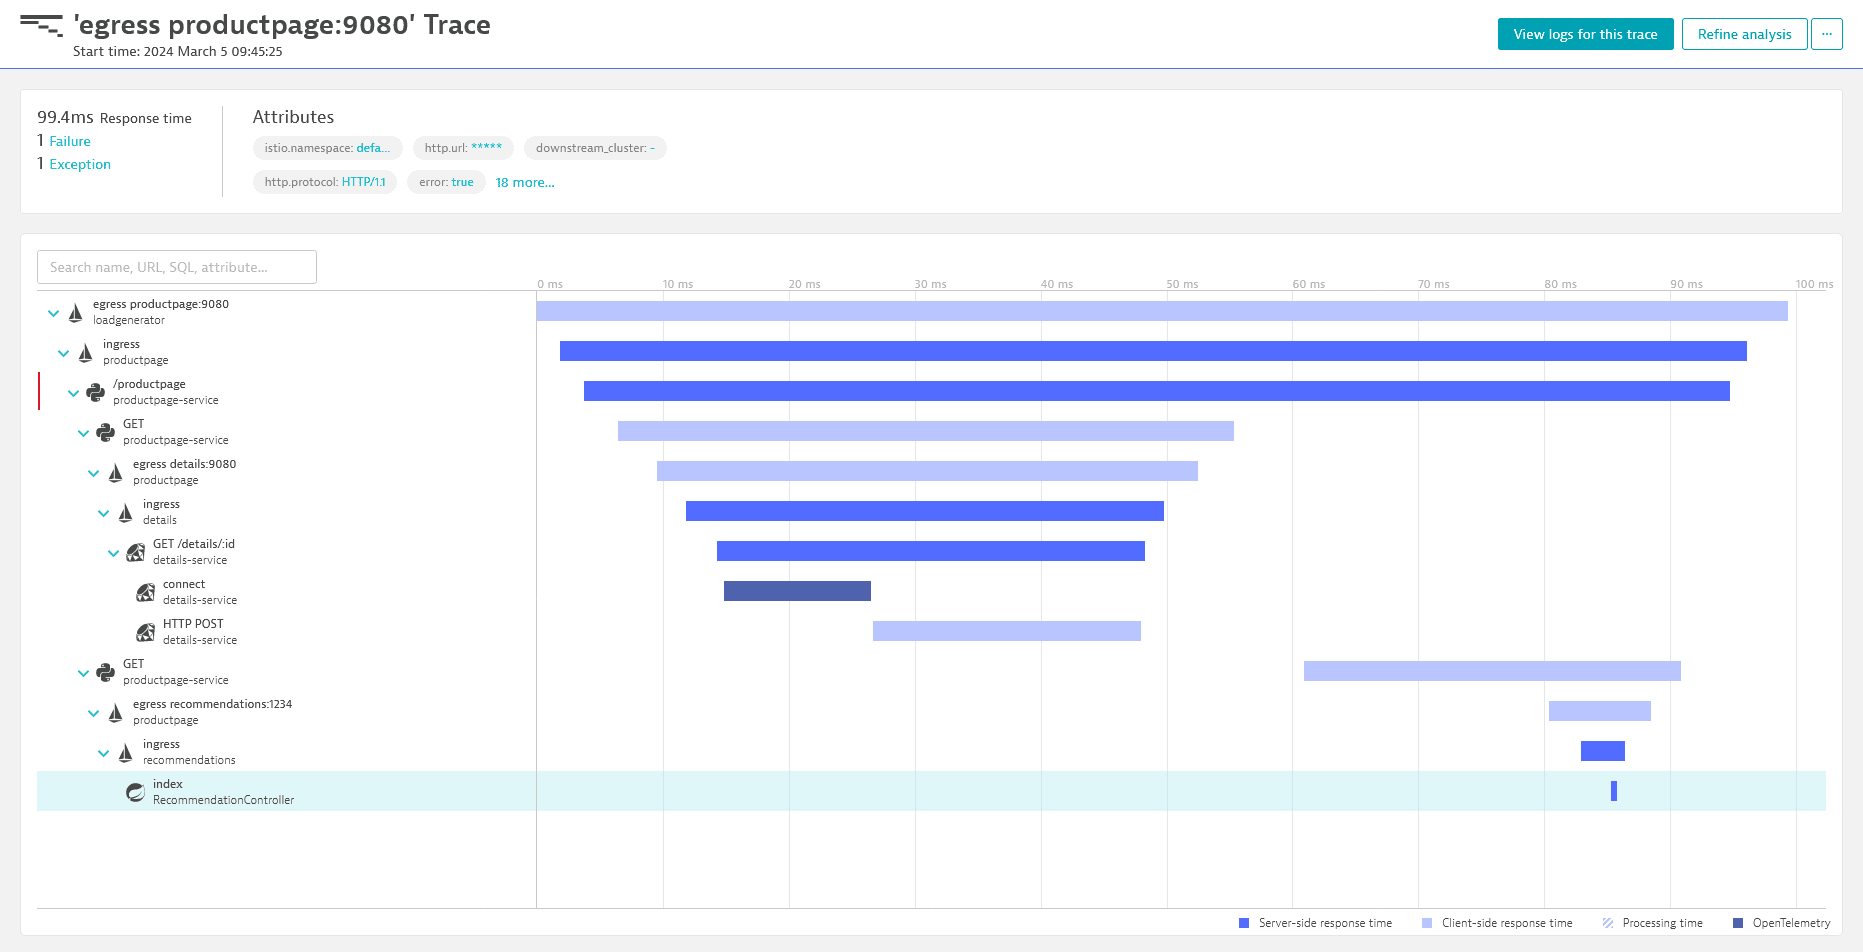
Once the setup is complete and you have ingested your first data, you can verify if the traces show up in Dynatrace.