Use dashboards
Latest Dynatrace
These procedures describe the basics of using dashboards and get you started on the way to customizing and creating your own dashboards.
List all dashboards
To list dashboards
-
Go to Dashboards.
-
In the Dashboards panel, the Recently modified section lists recently modified dashboards.
-
Hover over a dashboard name and select
 for a menu of available commands for that dashboard. In this example, we would display the menu for a dashboard called
 my dashboard 3.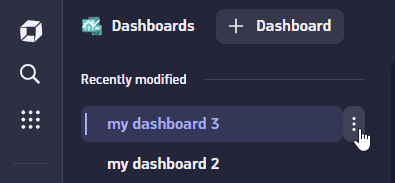
The commands you see in the menu depend on your permissions for that dashboard. For example, you can't rename someone else's dashboard unless they have given you edit permissions for that dashboard. (But you can make a copy of a shared dashboard and then edit your copy.)
 Rename enables editing for the dashboard name
 Make a copy duplicates the dashboard
 Download as JSON writes the dashboard to a JSON file that you can import
 Delete removes the dashboard permanently
This icon
 after a dashboard name means someone shared that dashboard with you.
 -
To display a table of all dashboards to which you have access—your own dashboards and all dashboards that people have shared with you—select
 View all dashboards.
- To sort the table, select the Name or Last modified header.
- To filter the table by a search string, enter the string in the
 filter bar above the table.
 - To create a new dashboard, select New dashboard in the upper-right corner.
- To delete a dashboard, select in the Actions column. If there's no icon for a dashboard, it means you have permission to view that shared dashboard but not to delete it.
- To upload a dashboard, select
 Upload in the upper-right corner.
-
To close the Dashboards table and return to your initial view, select Dashboards in the upper-left corner of the Dashboards page.
Display a dashboard
To display a dashboard
-
Go to Dashboards.
-
In the Dashboards panel, select the name of the dashboard. In this example, we open
my dashboard 2.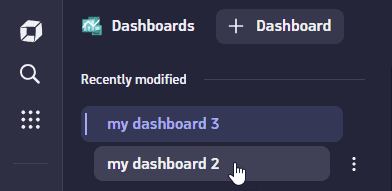
Set the timeframe
The timeframe describes the when of the data on the dashboard.
- When you open a dashboard for the first time, the default timeframe (Last 2 hours) is applied.
When you open that dashboard a subsequent time, the timeframe from your previous session with that dashboard is applied.
When you open a dashboard via a link, if a timeframe is included in the link, the link timeframe is applied.
To change the dashboard timeframe
- In the upper-right corner of the dashboard, open the timeframe selector menu (the default is Last 2 hours
 ).
). - Select a new timeframe.
- To select a standard timeframe, choose one of the standard Relative timeframes
- To define a custom timeframe, define the timeframe in the Custom timeframe panel and select Apply.
- Use the calendar buttons
 to select calendar dates
 - Edit the resulting From and To settings to fine-tune the range
- Use the calendar buttons
When you change the timeframe:
The new timeframe is displayed in the upper-right corner of the dashboard
The dashboard contents are recalculated and displayed according to the new timeframe
You can specify a custom timeframe in a data tile's DQL query so that it ignores the dashboard timeframe set in the upper-right corner of the dashboard. Using this method, a dashboard can have multiple tiles where each tile has its own timeframe.
Example timeframe specification in DQL:
fetch [recordtype], from:now() - 2h| ....
For details on specifying a timeframe in DQL, see Specify timeframe in the DQL documentation.
Interact with a tile
If you see something on a dashboard that you want to zoom in on, you can maximize it and have a closer look, and then minimize it again when you're done.
When you maximize a tile, it is temporarily zoomed to the maximum size of the display so you can see the details of the selected tile.
To maximize a tile
Hover over the tile to display the tile-specific commands.
- Select
 Maximize.
To return to the normal dashboard view, select Minimize in the upper-right corner.
Run a code tile
When you open a document from another user, you may see the following message:
This dashboard contains custom code. It is read-only until you review the code and select “Accept and run”.
When you run a code tile or section written by another person, Dynatrace executes the other person's JavaScript using your user account and your permissions. This is a powerful feature, but it needs to be used correctly and responsibly. The JavaScript code can access external APIs on your behalf (using your account and permissions).
To review code
-
Select Review all code.
The Review code page displays each code tile's code in a separate box.
-
Review the code and decide whether you want to run it.
If you want to run the code, you can approve it just this time or permanently.
- To run the code just this time, select Accept and run. The next time you open this document, you will be asked once again to review the code before running it.
- To permanently accept the code in this document, select Always trust code in this document and then select Accept and run.
Change variable values
If a dashboard has one or more variables, they are listed by name along the upper-left of the dashboard, under the dashboard name. When you change variable values, the dashboard contents are recalculated and displayed according to the new values.
To change the value of a variable
-
In the upper-left of the dashboard, locate the variable name in the upper-left of the dashboards.
-
Use the menu or edit box under the variable name to change the value.
If the variable allows just one selection (value) at a time, select the value that you want to apply to the dashboard.
If the variable allows multiple selections (values) at a time, select the checkbox for each value you want to apply to the dashboard. The menu name for that variable shows how many values are selected.
For a text variable, you can edit the text in the box under the variable name.
Refresh a dashboard
When you open a dashboard for the first time, the refresh rate is set to Off (no automatic refresh).
Manual refresh
To refresh the current dashboard manually, in the upper-right corner of the dashboard, select  (in the
  pair).
Automatic refresh
To refresh the current dashboard automatically, in the upper-right corner of the dashboard, select (in the pair) and select a refresh rate.
Offturns off automatic refreshOther settings will refresh the dashboard at the specified interval
If you change the refresh rate, that rate is remembered the next time you open the dashboard.
A frequent refresh rate can keep you literally up to the minute, but a complex dashboard may take some time to recalculate each time it is refreshed. Choose a refresh rate that suits your needs and the complexity of the dashboard.
Download result
To download (export) the result of the current dashboard tile or notebook section
-
Hover over the tile or section to display available commands.
-
On the command bar, select
More actions > Download result > [format].The result is downloaded to a local file in the selected format.
The selection of download formats available depends on the visualization.
- CSV: The result is downloaded to a local comma-separated values (*.csv) file
- JSON: The result is downloaded to a local JSON (*.json) file
Some visualizations offer no option for downloading the result.
Share a dashboard
If you own a document (dashboard or notebook), you can share it.
There are two ways to share a document with other Dynatrace users in your company:
- Share access: Create and maintain a list of users and user groups that can access the document.
- Share links: Create links (URLs) pointing to your document and distribute the links through the channel of your choice (email, for example).
These methods are not mutually exclusive. For example, you can maintain a focused list of users for ongoing access to the document (maybe everyone in a certain group edits the document regularly) and you can create and distribute view-only links for a wider audience as needed.
In either case, you control whether people can edit the document or only view it.
For details on sharing documents, see Share documents.
Duplicate the current dashboard
To make a copy of the current dashboard
-
At the top of the dashboard, select the dashboard name.
-
In the menu, select
 Make a copy.
A copy is created with the name Copy of + the name of the current dashboard. The copy is now listed in the Dashboards panel.
Download a dashboard
To download (export) the current dashboard as JSON
At the top of the dashboard, select the dashboard name.
- From the menu, select Download as JSON.
The definition of the current dashboard is downloaded to a local JSON file.
To download (export) a dashboard from the side panel
-
Go to Dashboards.
-
In the Dashboards app, the side panel lists your Recent dashboards.
-
Hover over the name of the dashboard you want to export and select
> Download as JSON. The dashboard is downloaded to a local JSON file that you can upload.
Upload a dashboard
To upload (import) the JSON definition of a dashboard from the Dashboards side panel
- In the Dashboards app, in the Dashboards panel on the left, select Upload.
Find and open the dashboard JSON definition file.
To upload (import) the JSON definition of a dashboard from the Dashboards table
-
Go to Dashboards.
-
In the Dashboards panel on the left, select
View all dashboards.A Dashboards table displays all dashboards by Name and Last modified date.
-
In the upper-right corner of the page, select
Upload. -
Find and open the dashboard JSON definition file.
An uploaded dashboard is:
-
Opened in Dynatrace.
If you see a message about running custom code when you upload a dashboard, see Run code warnings for more information.
-
Added to your Recent list.
-
Added to the Dashboards page with Last modified set to the upload date and time.
Copy to another document
Use Open with to copy a dashboard tile to another document (such as a different notebook or dashboard).
For example, an easy way to start a new document (dashboard or notebook) is to use Open with to copy reusable sections from existing documents (dashboards or notebooks) to a new document and then edit the copied sections as part of the new document.
To copy a dashboard tile to a notebook (as a notebook section)
-
In the dashboard, select the tile that you want to copy to a notebook.
-
Select
>  Open with.
 -
In the Open with… window, select the Notebooks option.
A Select destination box is displayed.
-
In Select destination, you can create a new notebook or select an existing notebook.
-
Select Add.
The Dashboards application opens with the selected section copied into a new or existing dashboard (depending on what you chose in Select destination).
For details, see Open with.